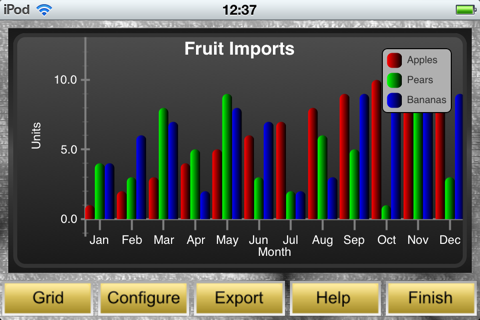
Chart Wizard is a simple to use way of creating, viewing and publishing charts from your data.
Enter data using the built-in grid (or import CSV data) and then display your chart on your device or publish it in various formats.
● Supports column, bar, pie, line, scatter and column range charts.
● Chart title, legend, layout, fonts, colours, fill styles can all be configured.
● CSV data can be imported via iTunes or Dropbox, or from email attachments.
● Data (and column and row headers) can be added or edited in the grid.
● Grid allows up to ten columns (plots) each with up to thirty rows of data.
● Charts can be viewed full screen on your device, ready to show your audience, or published in image and PDF formats to the devices photo album, clipboard or externally via iTunes, Dropbox or email.
● Most chart types support zooming and scrolling via pinching and swiping movements with your fingers.
● Chart projects can be saved (and reloaded) for later use.
● In-built help and sample projects included.


